Most new investors evaluate rental properties the same way: look at the monthly rent, subtract the mortgage payment, and call the difference profit. That math misses a lot. Vacancy, maintenance, insurance, property management, capital reserves, the real number after all of those is usually much smaller than the simple calculation suggests, sometimes by a factor of two.
Real rental property analysis runs through every dollar the property produces and every dollar it costs, before and after financing. Done right, it takes about 20 minutes on a property you're serious about. Done wrong, you buy something that looks profitable and discover the real numbers at the end of year one.
Here's how to do it correctly.
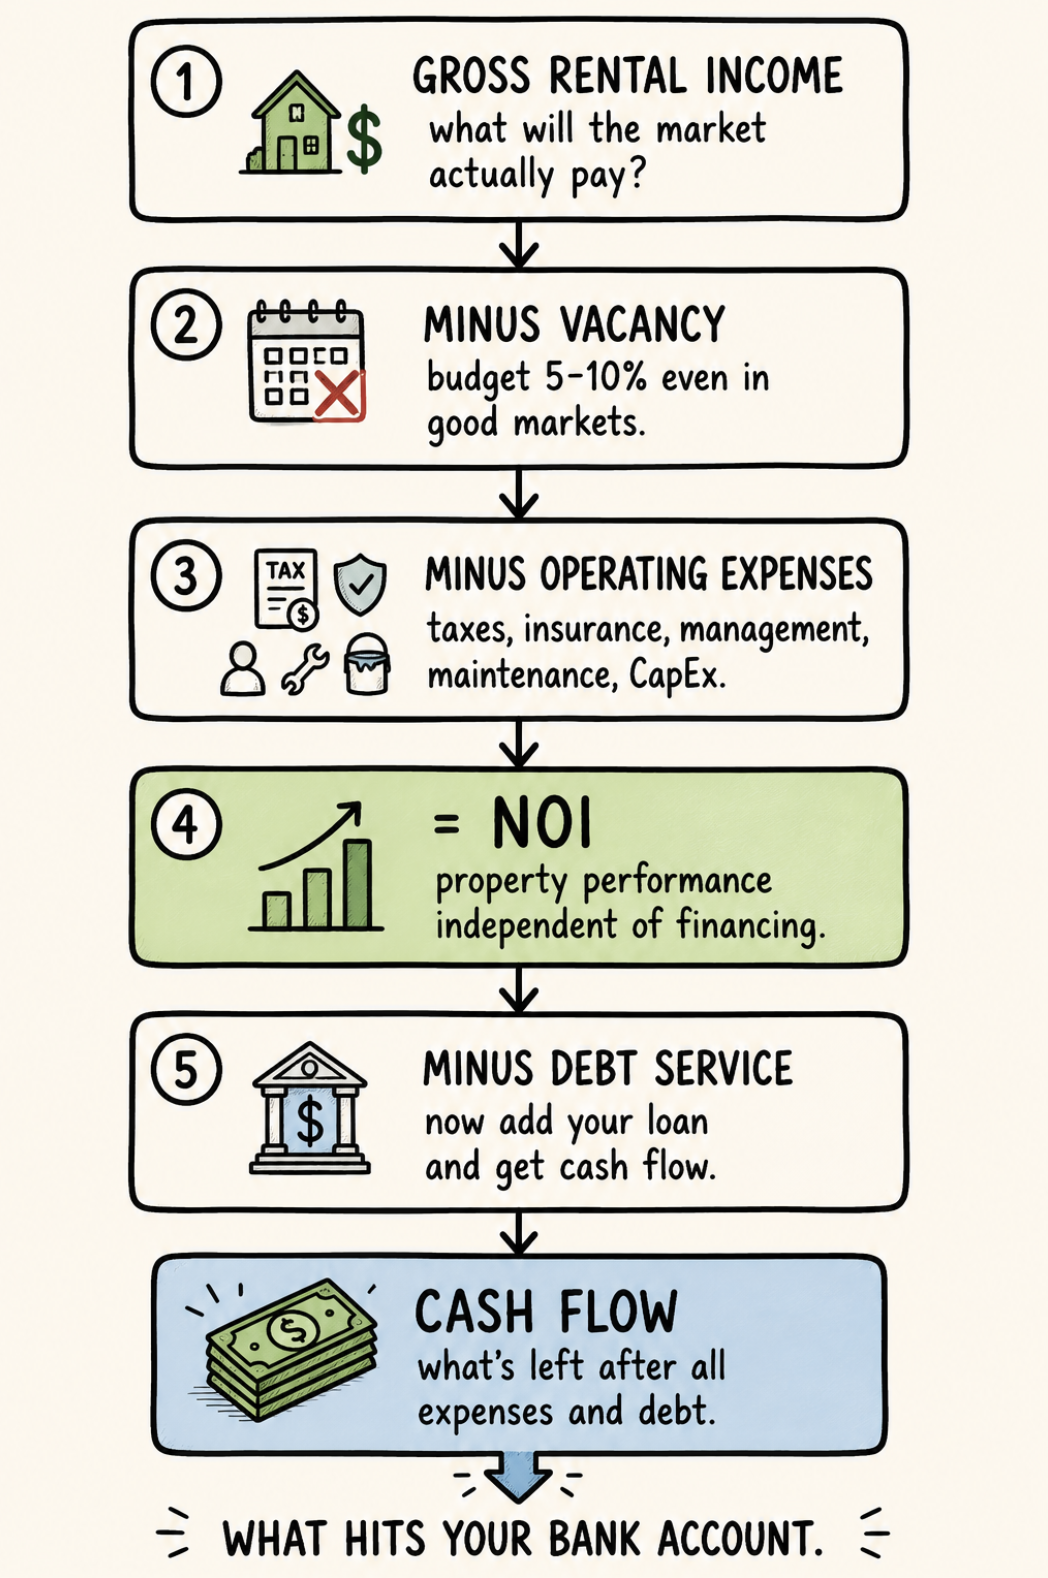
Step 1: Establish gross rental income
Start with the current rent if there's already a tenant in place, that's your actual income on day one. Then check it against market rate using Zillow Rental Manager, Rentometer, and comparable active listings within half a mile. Look for similar properties: same bedroom and bathroom count, similar square footage, similar condition.
If the current rent is below market, there may be room for an increase at the next lease renewal, but don't underwrite the deal assuming you'll raise it immediately. If there's no tenant, use market rent for comparable properties in that condition, in that location, at this point in time. The market will tell you what it will pay.
Add any ancillary income that's realistic: parking fees if you're charging separately, pet rent, laundry income on multifamily. Don't invent income that doesn't exist yet.
This is your gross potential income, what the property would earn at 100% occupancy with market-rate rent.
Step 2: Apply a vacancy rate
No property is occupied 100% of the time. Tenants leave, units turn, and there's always some gap between tenants. Most investors plan for at least one vacant month every twenty months, which produces a 5% vacancy rate. In more challenging rental markets, budget for 1-1.5 months of annual vacancy, an 8-12% vacancy rate.
Single-family rentals in high-demand markets can run below 5%. Properties in softer markets or with higher turnover should be modeled at 8-10%. Whatever you use, be honest; overstating occupancy is one of the most common ways deals look better on paper than they turn out in reality.
Gross potential income minus vacancy loss = Effective Gross Income.
Step 3: Build the expense stack
This is where most beginners go wrong. They account for the mortgage and maybe property taxes, and call it a day. Actual rental property expenses include:
Property taxes. Look up the actual tax bill for the property from the county assessor. Don't estimate. Tax rates vary enormously by location and assessment. (When using ChatARV to analyze, the property taxes are filled in for you).
Insurance. Landlord insurance on a single-family rental typically runs $100-200 per month. Get an actual quote for the specific property.
Property management. Even if you plan to self-manage, model 8-10% of collected rent for management. It represents the cost of your time, and if you ever stop self-managing the numbers need to work with management included. Property management monthly fees typically range from 8-10% of monthly rent collected, with some managers also charging an initial tenant placement fee.
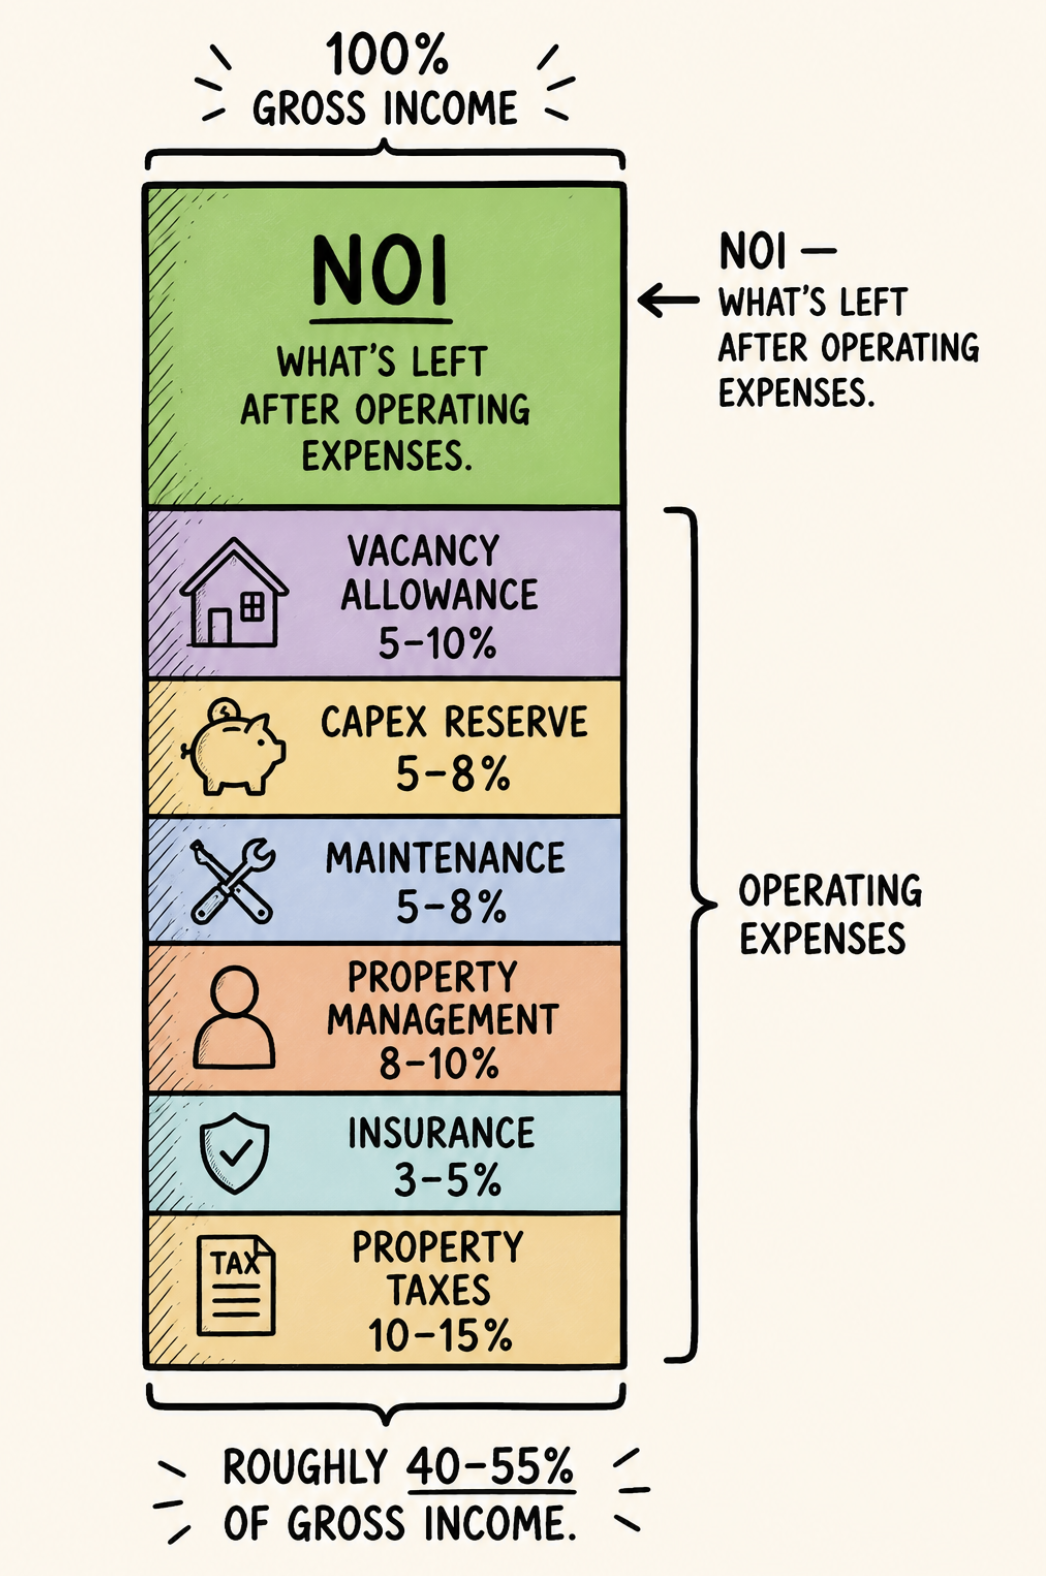
Maintenance and repairs. Budget 5-8% of gross rent annually for routine maintenance. This covers appliance repairs, minor fixes, and ongoing upkeep. It won't be perfectly smooth — some months nothing, some months $1,200 for a water heater — but averaging across the year works for analysis.
Capital expenditure reserves (CapEx). This is the one most beginners forget entirely. Big-ticket items — roof, HVAC, water heater, flooring, appliances — don't break every year, but they will eventually. A common recommendation is setting aside 15-30% of gross monthly rent across operating and CapEx reserves combined. For practical analysis, budget 5-8% of gross rent annually for CapEx on top of maintenance. Older properties need more.
HOA fees. Most properties don't have HOA fees, but if they do they are fixed and must be budgeted in.
Lawn and landscaping. In single-family rentals this is often the tenant's responsibility under the lease, but confirm. If it's yours, costs vary significantly by market and property size. Budget accordingly and get a local quote.
All of these expenses except mortgage payments make up your operating expenses. The sum total of effective gross income minus operating expenses = Net Operating Income (NOI). This is the property's income independent of how it's financed.
A useful gut check: the 50% rule says a property's operating expenses will roughly equal half its gross annual rental income. It's a rough approximation, newer properties run below 50%, older properties with more management run above, but if your analysis is coming in at 30% operating expenses on a 1970s rental, you're probably missing something.
Step 4: Calculate your key metrics
With NOI in hand, you can calculate the numbers that tell you whether this deal is worth pursuing.
Cap rate: NOI ÷ Purchase Price. This tells you the property's yield independent of financing. Compare it to similar properties in the same market to gauge whether the price is fair.
Debt Service Coverage Ratio (DSCR): Monthly rent ÷ Monthly PITIA (principal, interest, taxes, insurance, HOA). A DSCR of 1.0 means rent exactly covers the payment. Most lenders require 1.0-1.25 to qualify. Below 1.0 means you're supplementing the mortgage out of pocket every month.
Cash on cash return: Annual cash flow after debt service ÷ Total cash invested. Cash invested includes your down payment, closing costs, and any upfront renovation. This is what your money actually earns per year.
Monthly cash flow: NOI minus annual mortgage payments ÷ 12. The number that shows up in your bank account every month. In 2026, aim for conservative estimates: assume a 5-10% vacancy rate and budget for maintenance costs of around 1% of the property value annually.
Step 5: Stress test the numbers
A rental property analysis isn't complete until you've asked what happens when things go wrong.
What if vacancy runs at 10% instead of 5%? What if rent is $150/month lower than you projected? What if the HVAC fails in year two and costs $12,000? What if interest rates move up when you refinance in five years?
Run the scenario where two things go wrong simultaneously. If the deal still works, it's a real deal. If it only works when everything goes exactly right, the margin isn't there.
The property that looks like $400/month in cash flow at optimistic assumptions often produces $80/month, or breaks even, at conservative ones. That's not a bad property necessarily. It's just a deal where the return comes from appreciation and equity paydown rather than monthly cash flow. Know which one you're buying before you close.
A worked example
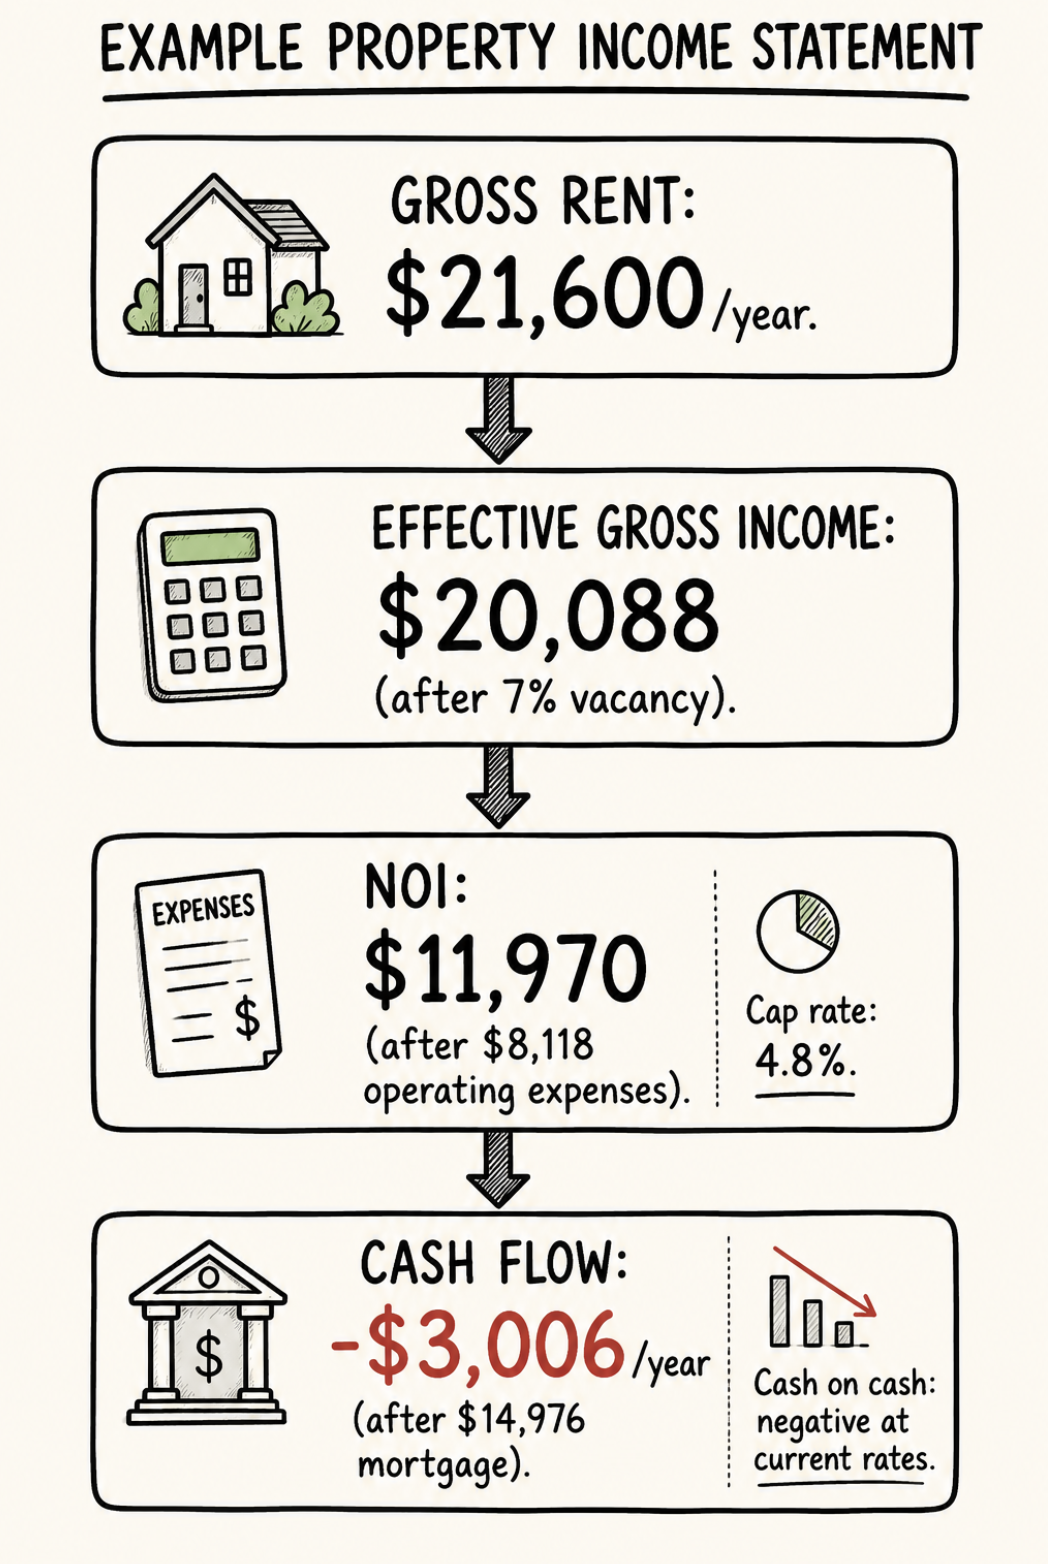
Property: $250,000 purchase price, 3-bed 2-bath single-family, market rent $1,800/month.
Income:
Gross potential income: $1,800 × 12 = $21,600
Vacancy (7%): −$1,512
Effective gross income: $20,088
Operating expenses:
Property taxes: $2,400/year
Insurance: $1,500/year
Property management (9%): $1,808/year
Maintenance (6%): $1,205/year
CapEx reserve (6%): $1,205/year
Total operating expenses: $8,118
NOI: $20,088 − $8,118 = $11,970/year
Cap rate: $11,970 ÷ $250,000 = 4.8%
Financing (25% down, DSCR at 7%):
Down payment: $62,500
Closing costs: $4,000
Total cash invested: $66,500
Loan: $187,500 at 7% = $1,248/month = $14,976/year
Annual cash flow: $11,970 – $14,976 = –$3,006/year
Monthly cash flow: –$250/month
This is a negative cash flow deal at these terms. That ties directly into the stress test section above, the property isn't producing monthly income, so the return depends entirely on appreciation and equity paydown. Worth flagging that clearly so readers don't miss the implication.
Cash on cash return: negative
This is a real outcome on a real property in 2026 at current financing rates. The 4.8% cap rate is fine. The financing turns it into negative monthly cash flow. The deal might still make sense if you believe in the market's appreciation trajectory and you're building equity via mortgage paydown, but you need to know the actual numbers to make that decision.
ChatARV's free buy-and-hold calculator runs every step of this analysis automatically, NOI, cap rate, DSCR, cash on cash return, and monthly cash flow, so you know exactly what you're buying before you make an offer. Run your numbers here.
What the numbers can't tell you
The analysis tells you whether the deal makes financial sense. It doesn't tell you whether it makes sense for you, your time, your risk tolerance, your local market knowledge, your capacity to deal with maintenance calls and tenant problems.
A property that produces $150/month in cash flow after all expenses requires work to own. It needs your attention when things break, your judgment when tenants push back, your capital when something goes wrong outside your reserve model. The return has to justify that engagement, or the investment isn't worth it, regardless of what the spreadsheet says.
The investors who build real rental portfolios know both the math and the management side. Start with the math. Then decide whether the deal deserves the rest.