If you've spent any time looking at rental properties, you've run into both of these numbers. Cap rate and cash on cash return both express a rental property's performance as a percentage. They're often used in the same conversation. They're measuring completely different things.
Understanding the difference isn't academic; it changes which deals you pursue and which ones you pass on.
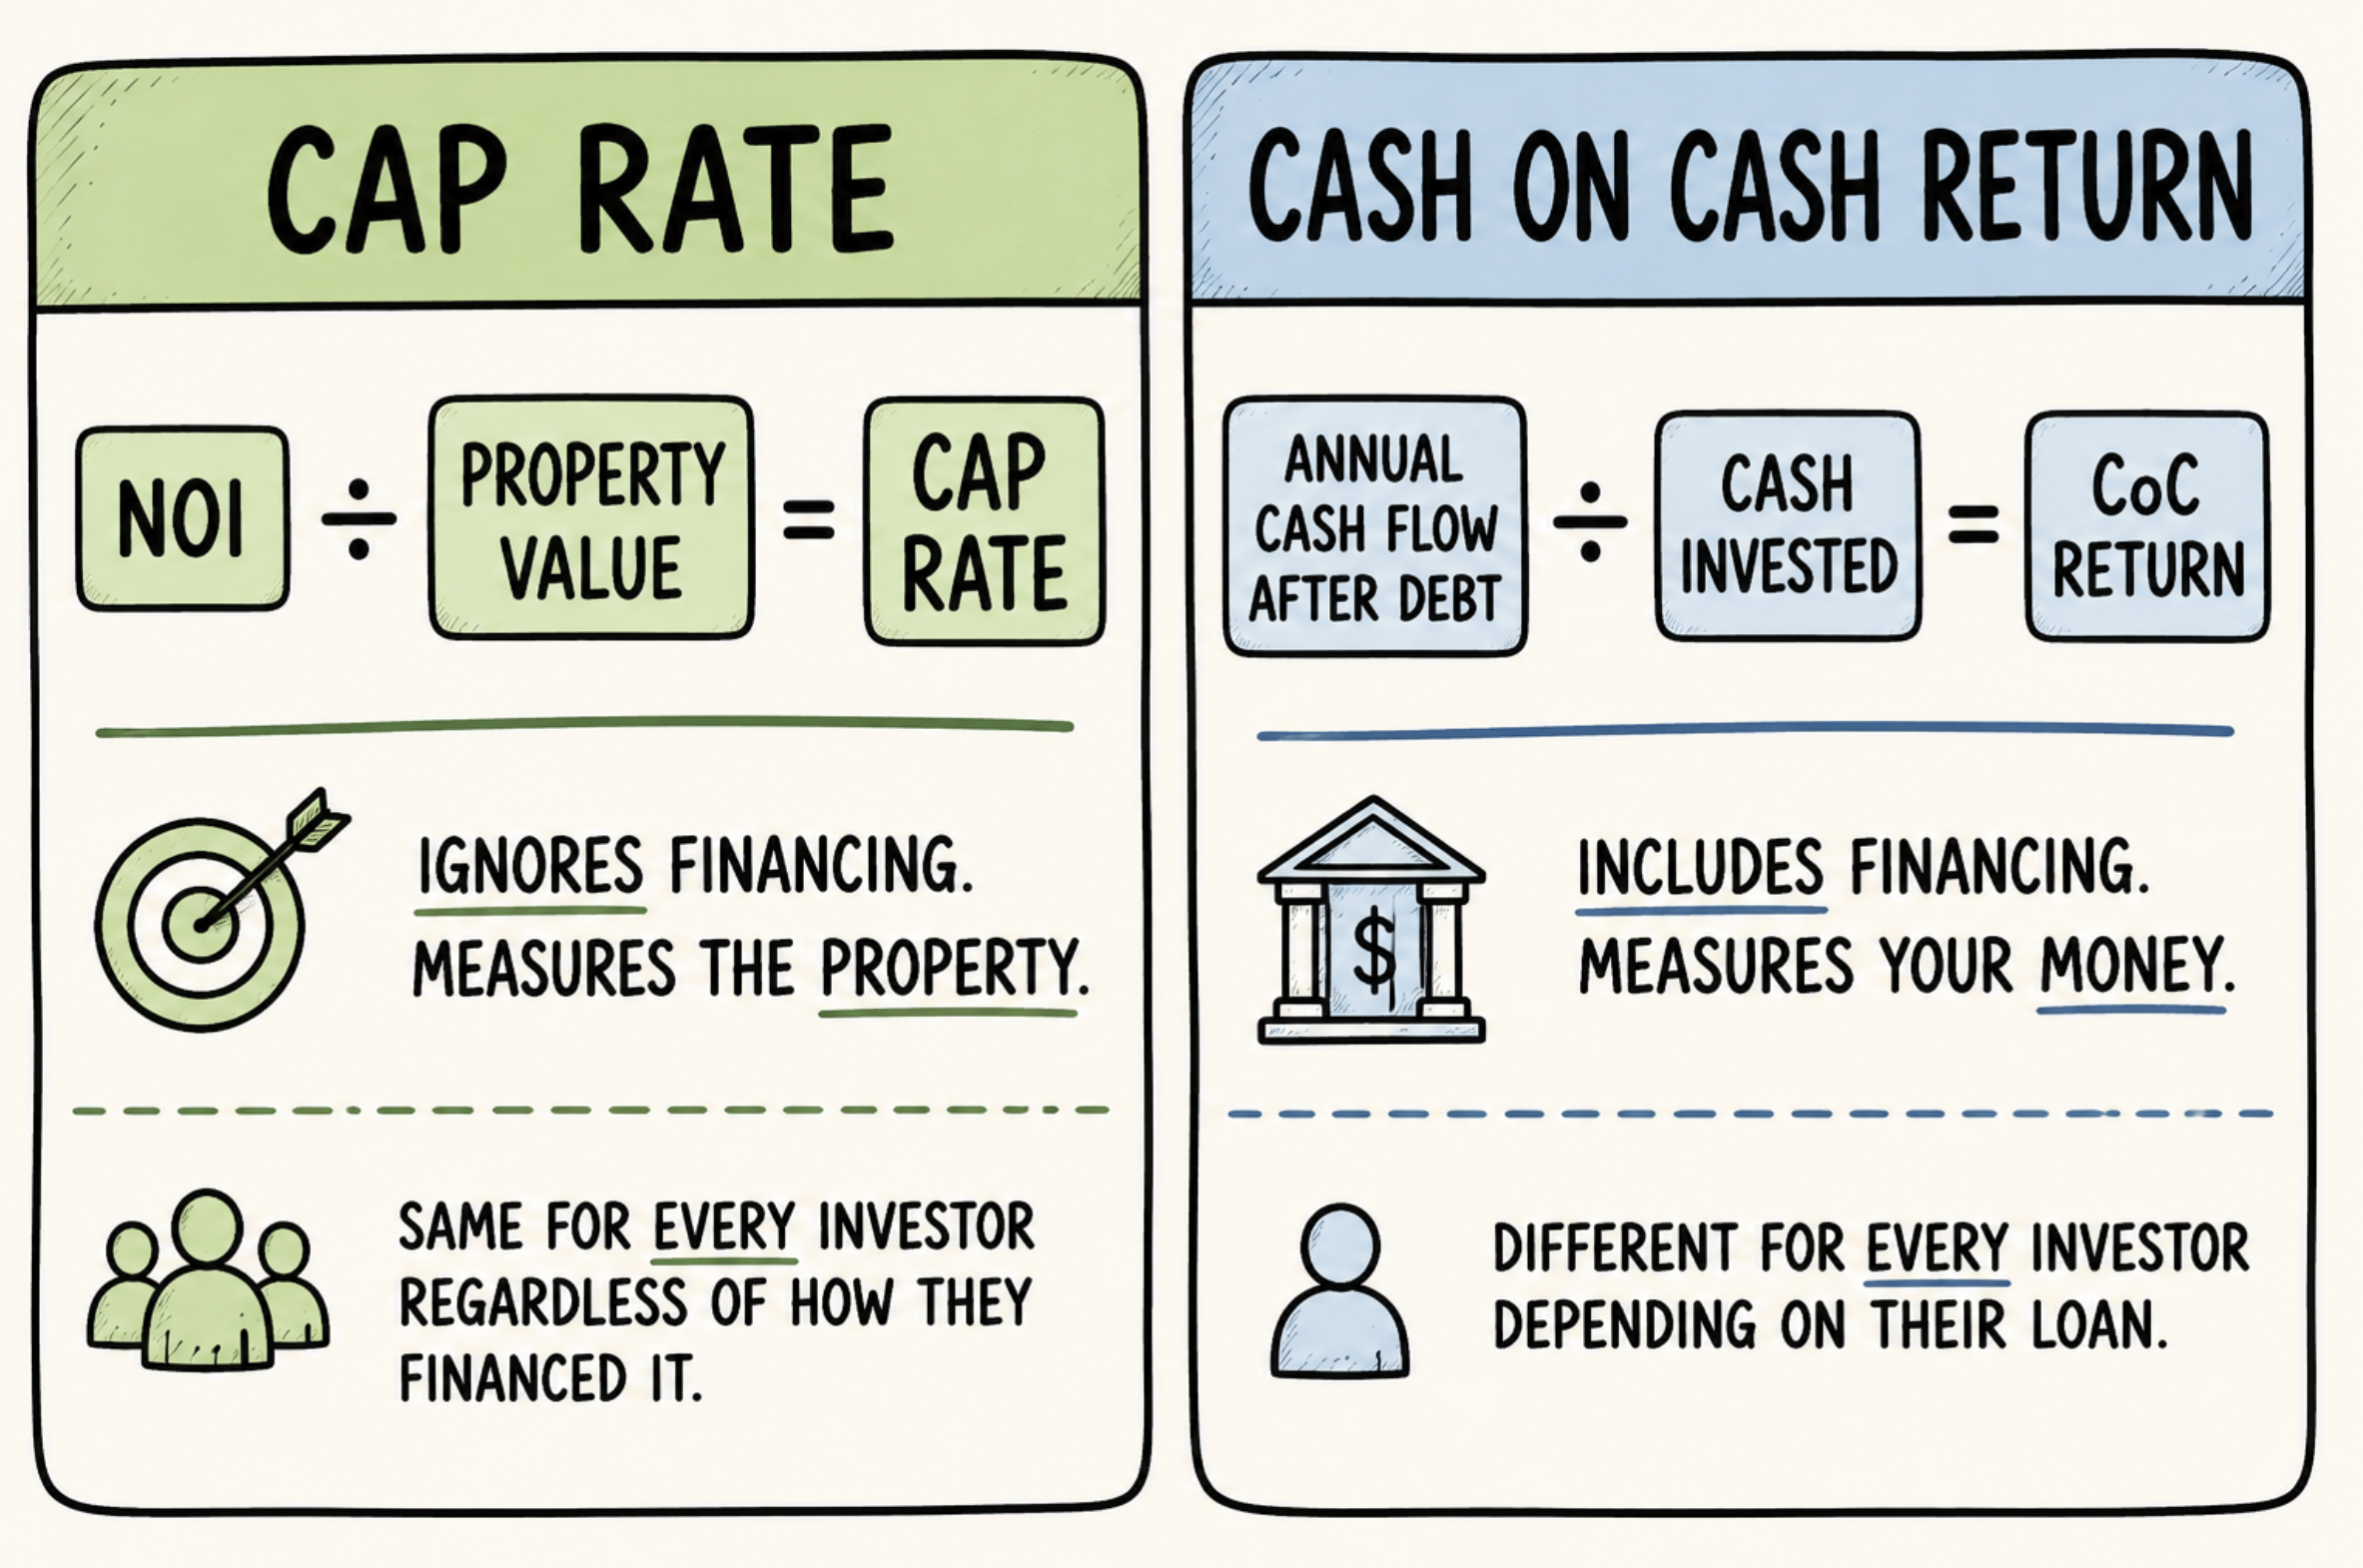
Cap rate: what the property produces, independent of how you financed it
Cap rate, short for capitalization rate, measures a property's income relative to its value, assuming you paid all cash. No mortgage. No financing.
Formula: Net Operating Income ÷ Property Value = Cap Rate
Net Operating Income (NOI) is your gross rental income minus all operating expenses, property taxes, insurance, property management, maintenance, vacancy allowance. It does not include mortgage payments. That's intentional. Cap rate is a property metric, not an investor metric.
Worked example: A property generates $18,000 per year in gross rent. After operating expenses of $6,000, the NOI is $12,000. You paid $200,000 for the property.
$12,000 ÷ $200,000 = 6% cap rate
That 6% tells you the property produces 6 cents of net income for every dollar of value. Two investors looking at the same property, one who paid cash, one who used a mortgage, will calculate the same cap rate. Financing doesn't enter the equation.
Cash on cash return: what your actual money earns
Cash on cash return measures what your invested capital, the cash you actually put in, earns each year after debt service.
Formula: Annual Cash Flow After Debt Service ÷ Cash Invested = Cash on Cash Return
Annual cash flow after debt service is your NOI minus your annual mortgage payments. Cash invested is your down payment plus closing costs plus any upfront renovation costs.
Same property, same NOI of $12,000. Now add a mortgage: 75% LTV at 7% on a $200,000 purchase means a $150,000 loan with a monthly payment of roughly $998, or $11,976 per year.
Annual cash flow after debt service: $12,000 − $11,976 = $24 per month, virtually zero.
Cash invested: $50,000 down payment + $3,000 closing costs = $53,000.
Cash on cash return: $24 × 12 ÷ $53,000 = essentially 0%
That's a 6% cap rate deal that produces almost no actual cash return for this investor at these financing terms. Same property. Completely different outcome depending on how it was purchased.
Why they diverge — and why that matters
The gap between cap rate and cash on cash return is the fingerprint of leverage. When borrowing costs are low relative to the cap rate, leverage amplifies returns, your cash on cash exceeds your cap rate. When borrowing costs are high relative to the cap rate, leverage destroys returns, your cash on cash falls below your cap rate. Investors call this negative leverage, and it describes most single-family rental deals at today's rates.
On a 7% cap rate deal with 70% leverage at 6.5% interest, your cash on cash might be slightly positive. Push the rate to 7.5% or the cap rate to 5.5% and you're in negative leverage territory, the mortgage costs more than the property earns before your own profit.
This is why cap rate and cash on cash return tell you different things and both matter:
Cap rate tells you whether the property is priced fairly relative to its income in the local market. It's a comparison tool. Two similar properties in the same neighborhood, one at a 5% cap rate and one at a 7% cap rate, the higher cap means either more income or a lower price. Figuring out which, and why, is the due diligence.
Cash on cash return tells you whether the deal actually works for you given how you're financing it. A 7% cap rate deal financed badly can produce worse cash on cash than a 5.5% cap rate deal financed efficiently.
What good numbers look like in 2026
Cap rate benchmarks for residential investors:
For residential rental properties, single-family homes or small multifamily, a good cap rate typically ranges from 4% to 6% in major metro areas and 6% to 8% in secondary or developing markets. Many cash flow-focused investors aim for 6%+ cap rates, while growth-focused investors in appreciation markets may accept 4-5%.
A 4% cap rate in a high-appreciation market like Austin or Denver is a different decision than a 4% cap rate in a flat market. In the former you're accepting thin current yield in exchange for long-term appreciation. In the latter you're just buying a property that doesn't pay you.
Cap rates above 10% on residential deals usually signal a problem, high vacancy, difficult location, deferred maintenance, or a distressed seller. Worth investigating before concluding it's a deal.
You can always ask your lender and fellow investors what cap rate they're typically expecting in your market.
Cash on cash benchmarks:
Most residential investors target 6-10% cash on cash as a baseline. Below 6% and the return doesn't justify the headache of being a landlord when you could put that capital in an index fund. Above 10% and you're either buying at a real discount, using significant leverage efficiently, or both.
At current financing rates, DSCR loans running 6.5-7.5%, achieving 8%+ cash on cash on a stabilized single-family rental requires either buying below market, charging above-market rent, or both. It's not impossible. It requires finding good deals, which is what the ChatARV platform is designed to help with.
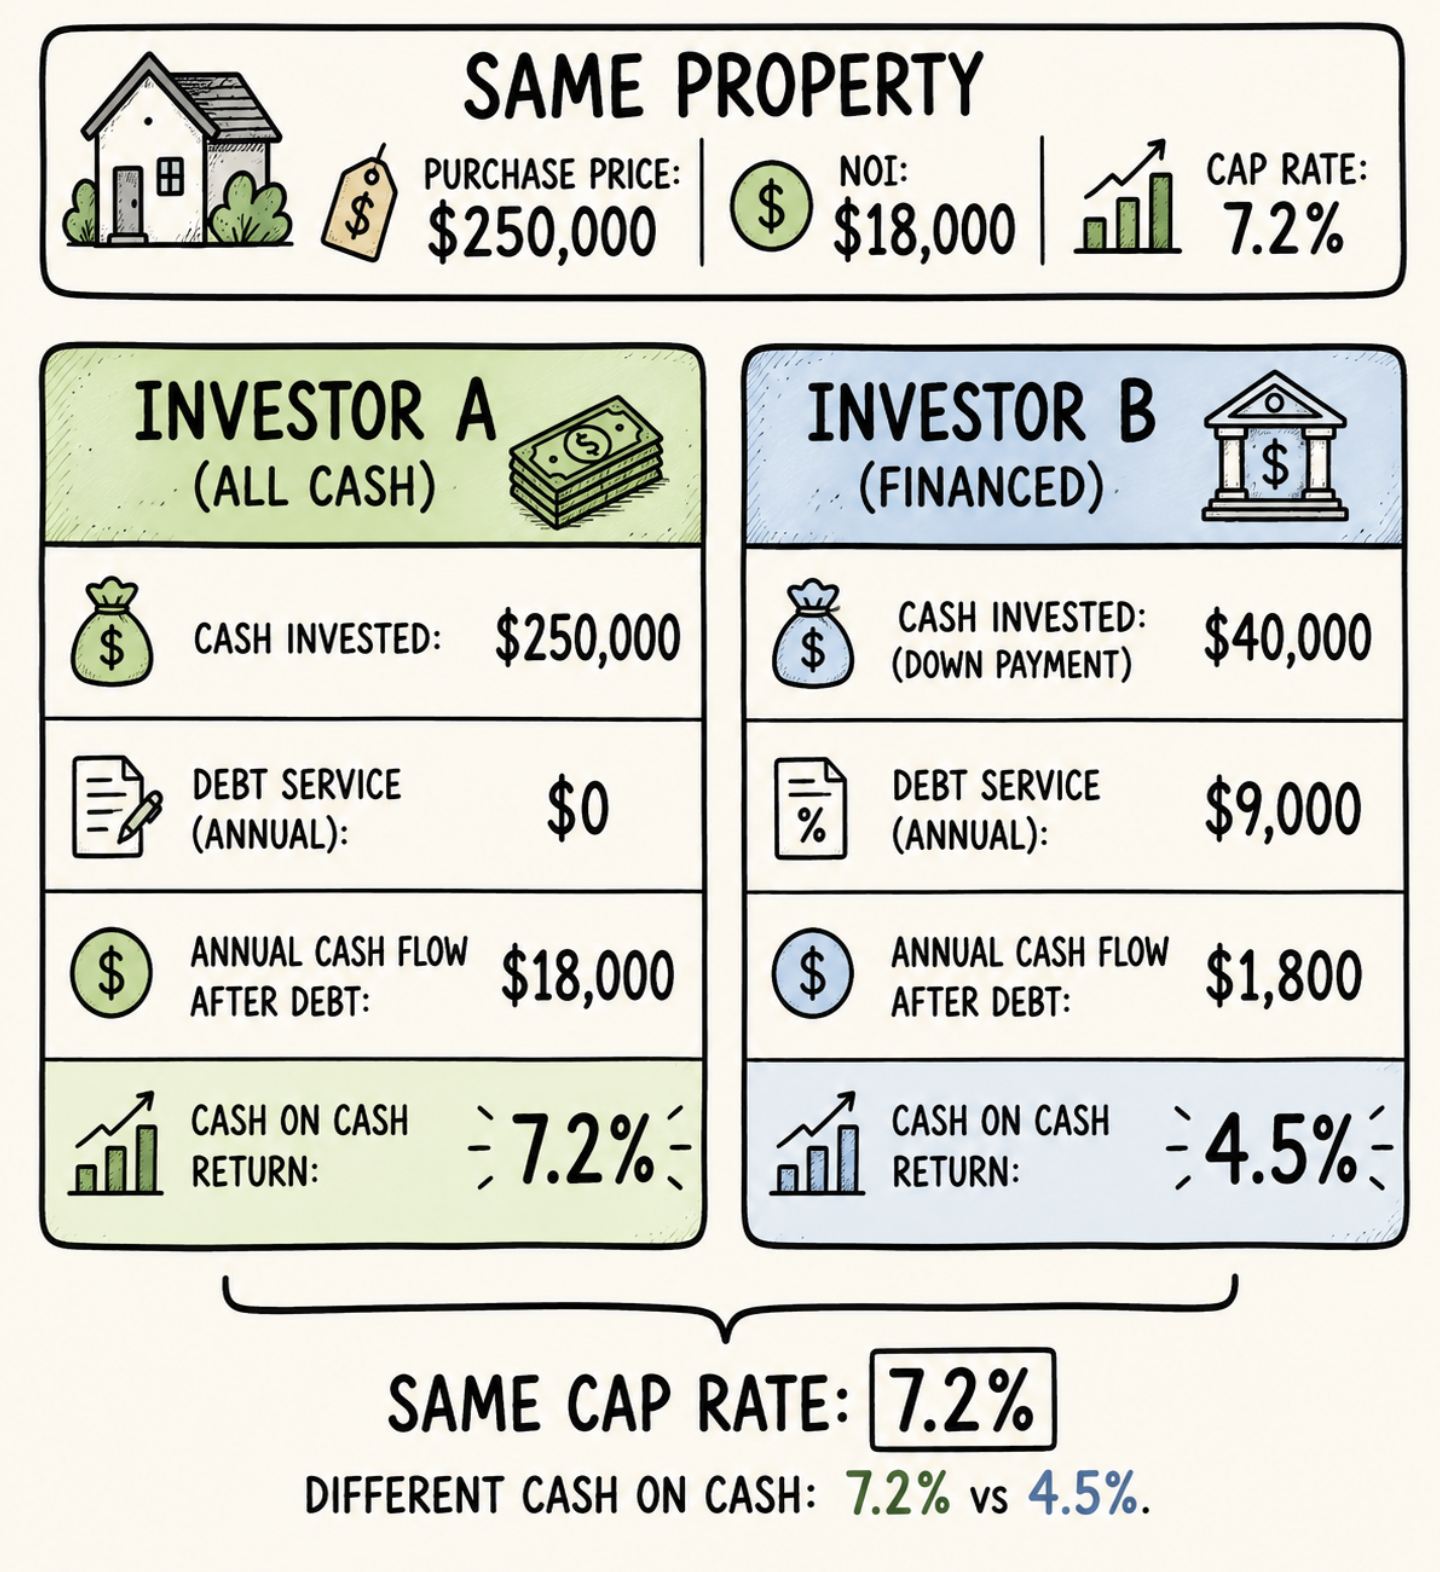
A side-by-side example
Same property. Two investors. Different financing.
Property: $250,000 purchase price, $18,000 annual NOI, 7.2% cap rate.
Investor A, all cash:
- Cash invested: $250,000
- Annual cash flow: $18,000 (no debt service)
- Cash on cash return: 7.2%
- Cap rate = Cash on cash return when there's no leverage
Investor B, 25% down, DSCR loan at 7%:
- Cash invested: $62,500 down + $4,000 closing costs = $66,500
- Loan: $187,500 at 7% = $1,248/month = $14,976/year
- Annual cash flow after debt: $18,000 − $14,976 = $3,024
- Cash on cash return: $3,024 ÷ $66,500 = 4.5%
The cap rate is 7.2% for both investors. The cash on cash return is 7.2% for the cash buyer and 4.5% for the financed buyer, because the mortgage costs almost as much as the property earns.
This is the math that explains why so many rental properties that look attractive on cap rate alone don't produce meaningful monthly income in 2026. The property is fine. The financing environment changed the math.
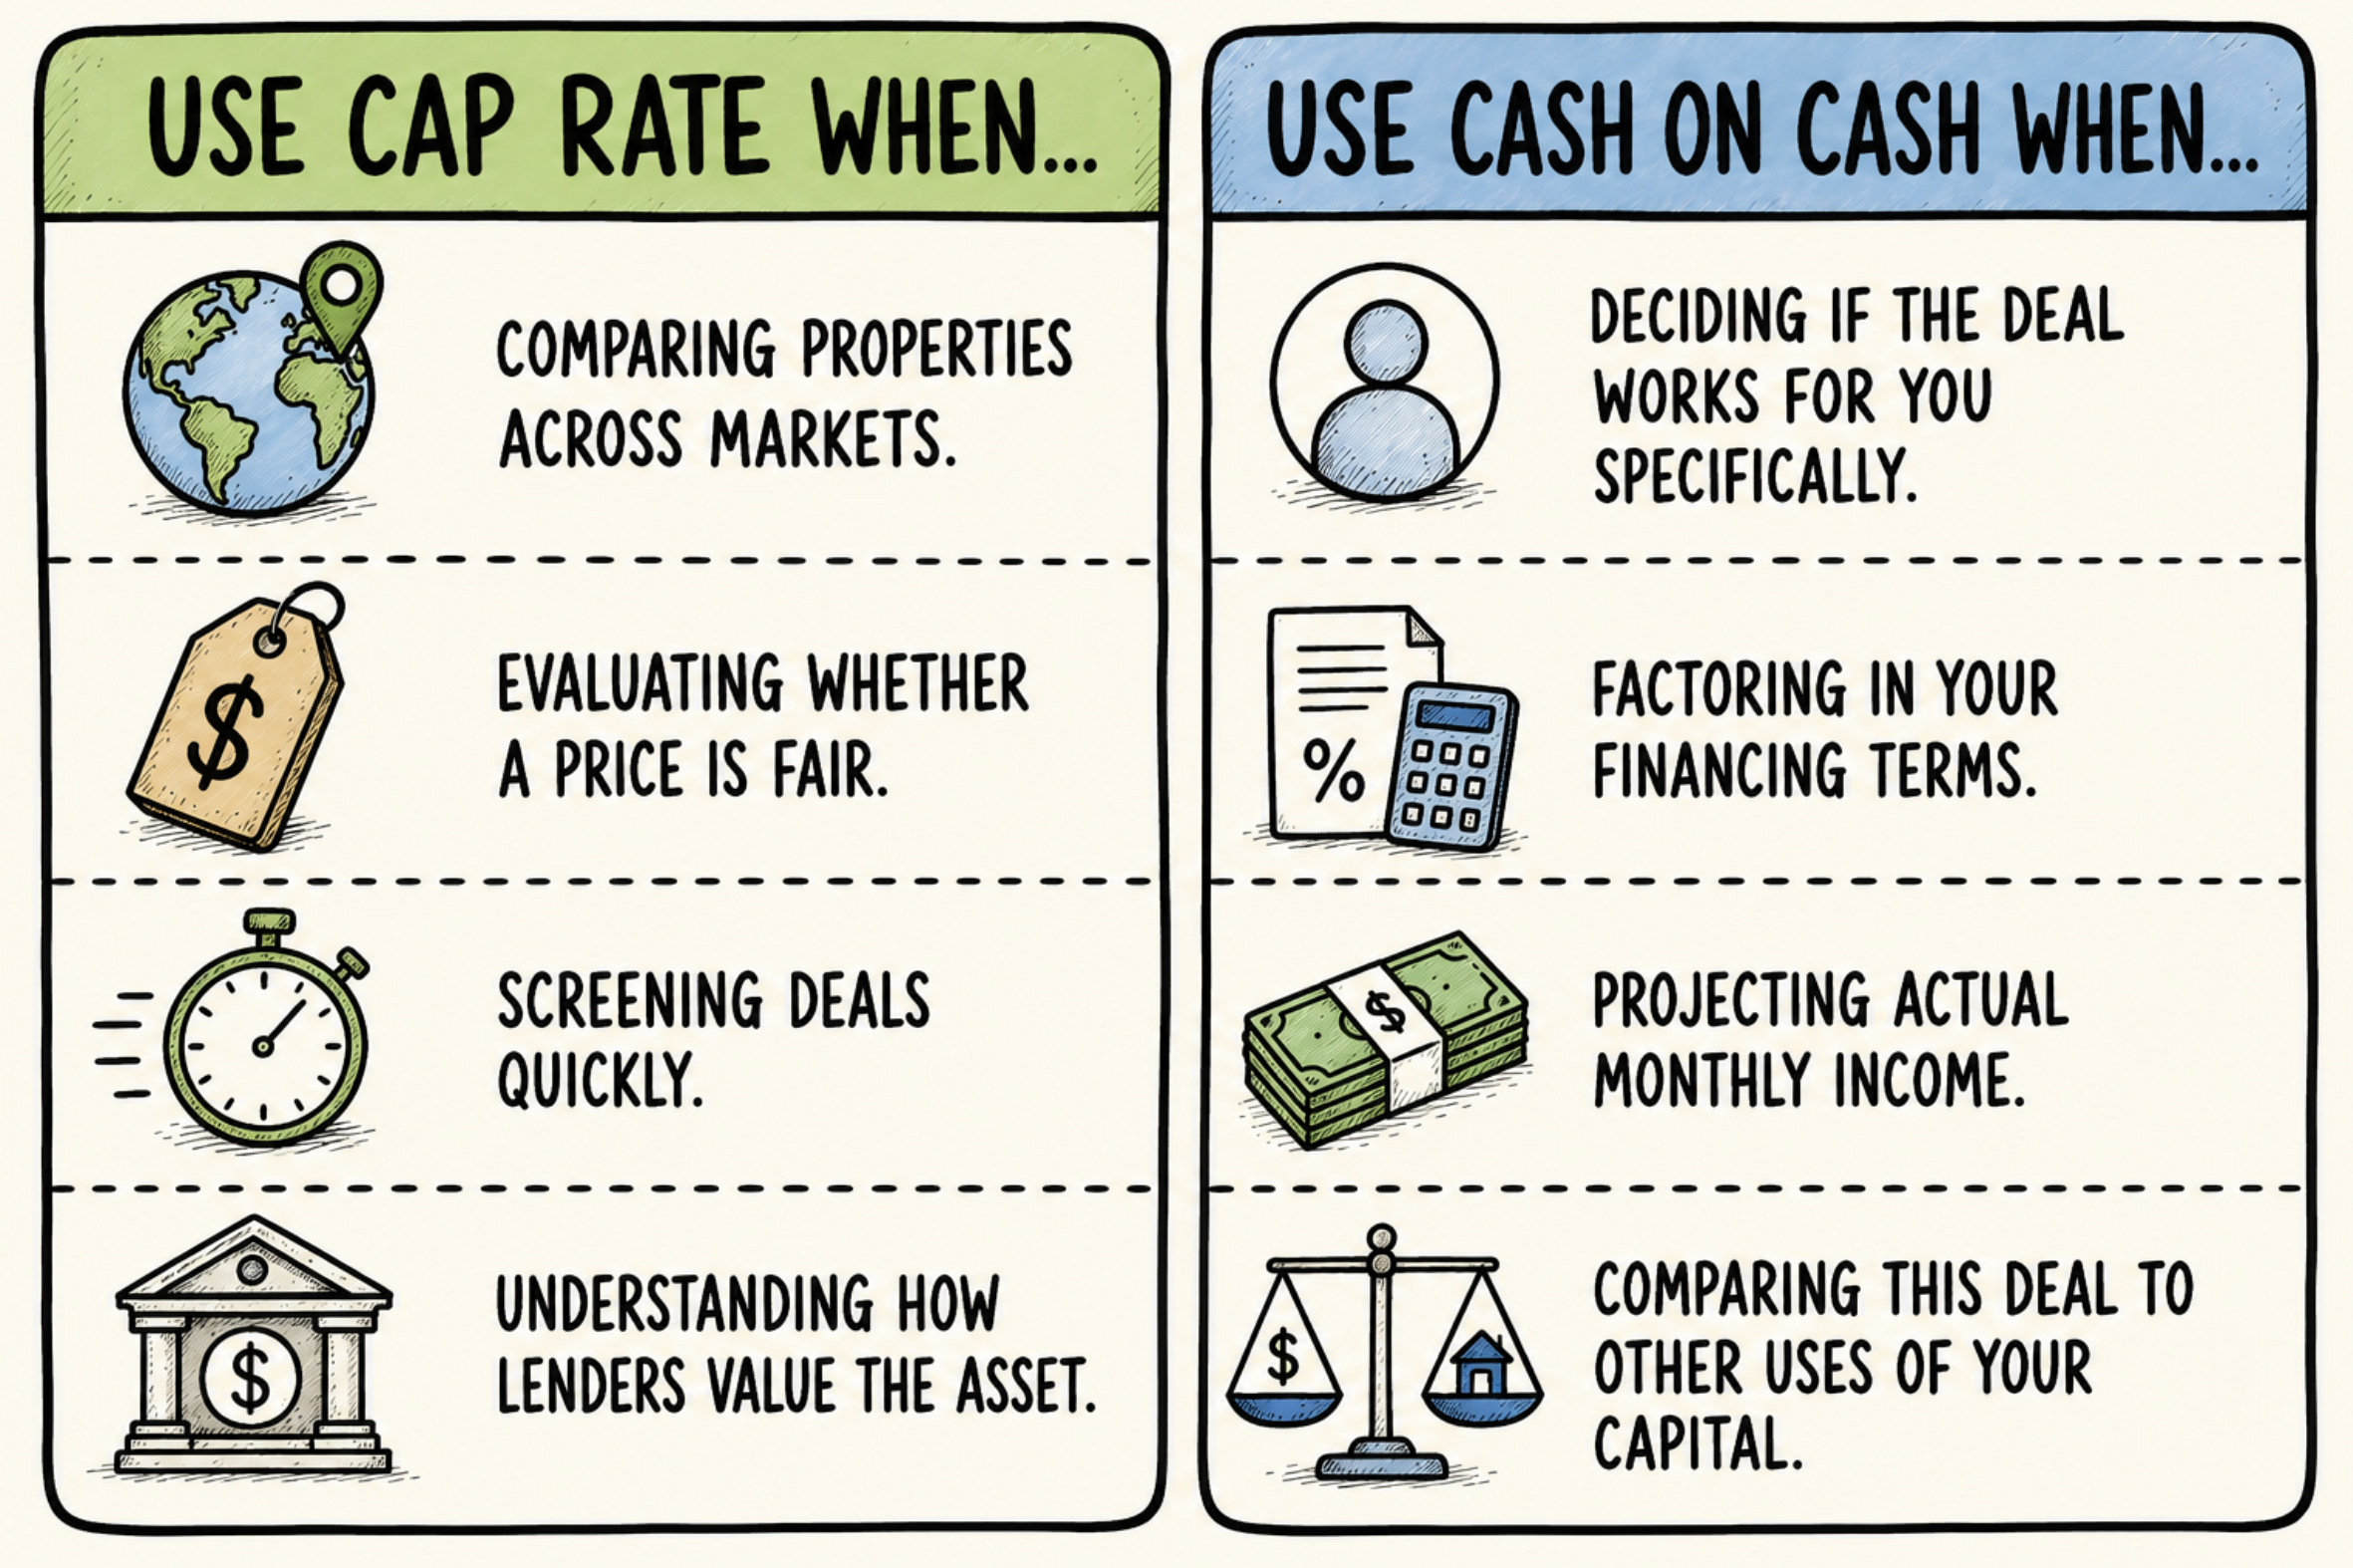
When to use each
Use cap rate to compare properties and evaluate pricing. When you're screening deals across different markets or neighborhoods, cap rate lets you compare apples to apples without letting each investor's financing situation complicate the comparison. It's also what lenders use to assess property value.
Use cash on cash return to decide if the deal works for you. Once you know how you're financing the deal, what rate, what LTV, what loan amount, cash on cash return tells you whether your cash actually works hard enough to justify the investment.
Use both together. A property with a strong cap rate and weak cash on cash is a clue to either negotiate the price down, find better financing, or wait for rates to move. A property with weak cap rate and strong cash on cash is usually a signal that the investor got unusually good financing, which may not be replicable.
ChatARV's free buy-and-hold calculator runs both metrics automatically, cap rate and cash on cash return, alongside full deal underwriting including NOI, debt service, and monthly cash flow. Run your numbers here.
The one thing most beginners get wrong
They treat cap rate as a verdict on cash flow and cash on cash as a verdict on value. It's the reverse.
Cap rate tells you about value and market pricing. Cash on cash tells you about cash flow and your actual return. Use cap rate to predict your monthly check and you'll be confused; the mortgage eats most of the NOI. Use cash on cash to judge whether a property is priced fairly and you risk overpaying for deals that only work because of favorable financing.
Know which question you're asking before you run the number.